
Magic Vizion - Chrome Web Store
Rate this Tool
Average Score
Total Votes
Select your score (1-10):
Detail Information
What
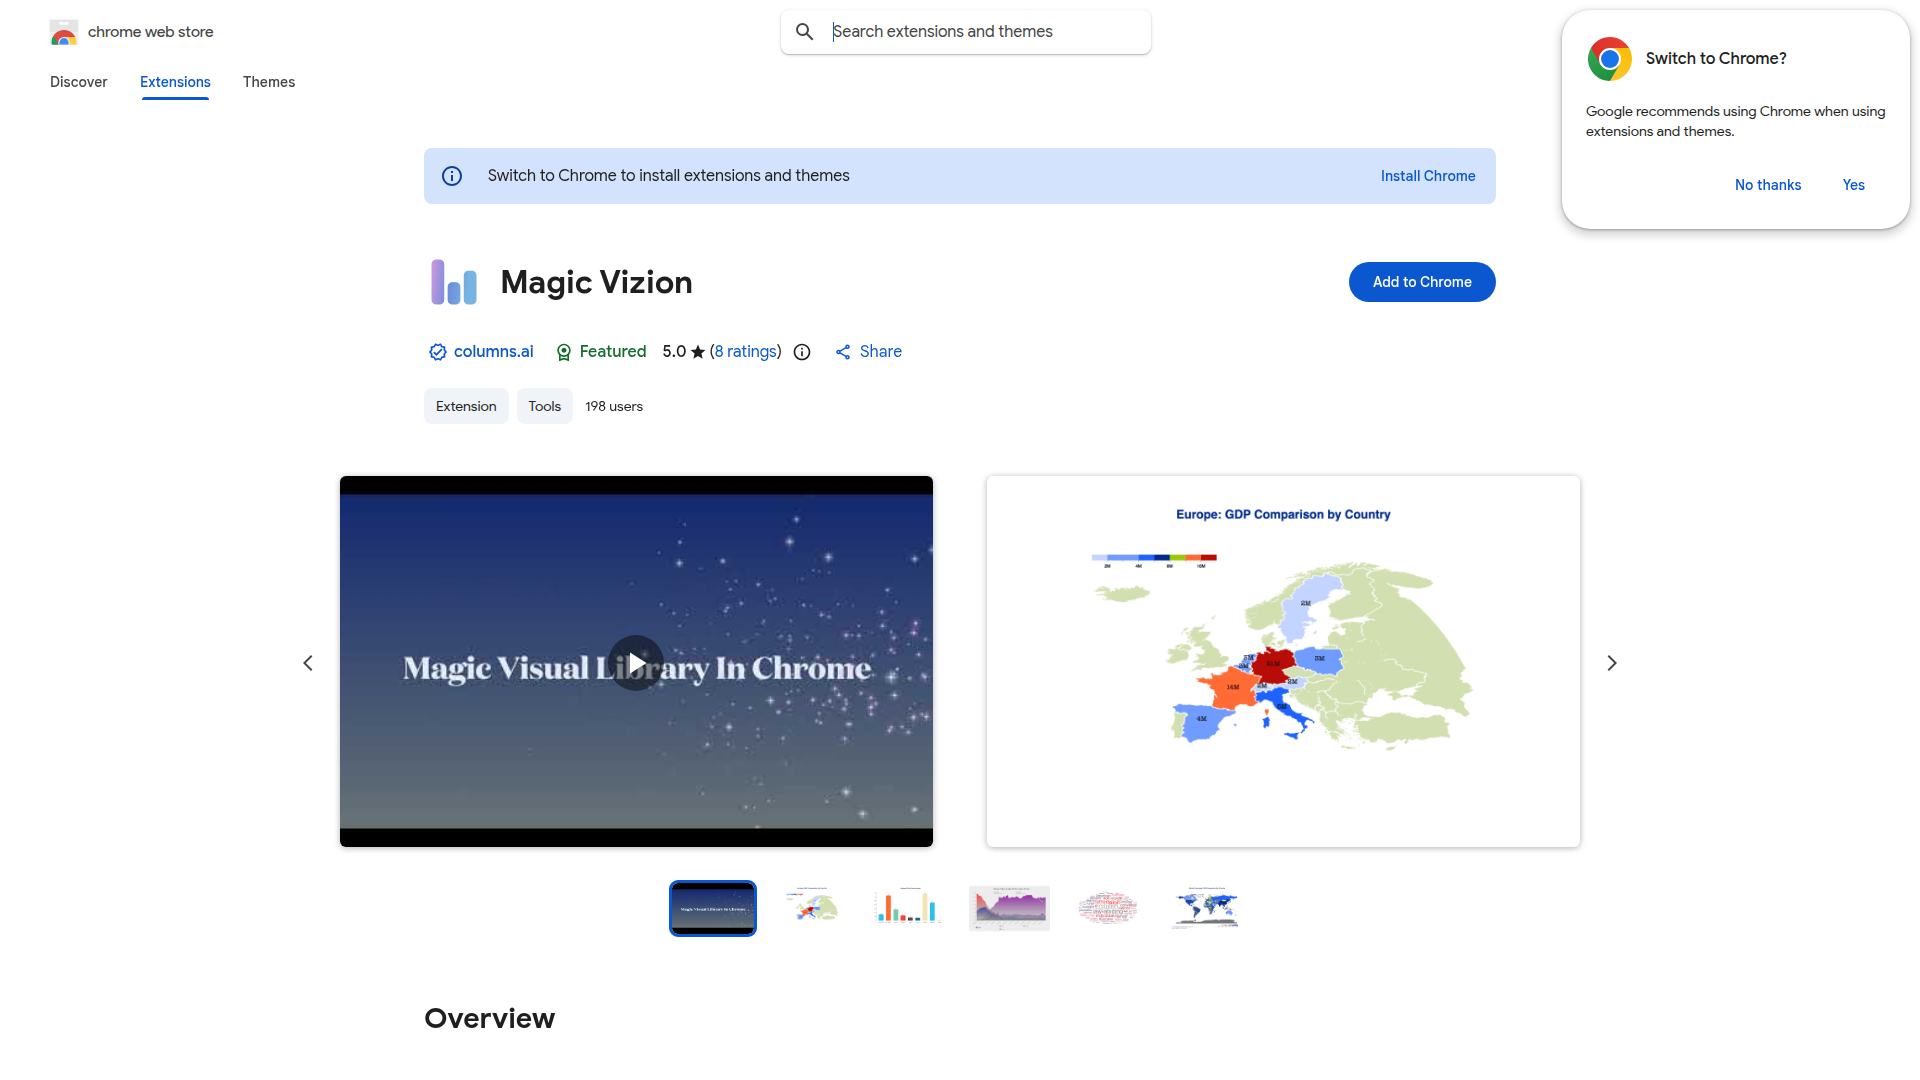
Magic Vizion is a Chrome extension from Columns that turns selected web content into interactive data visualizations inside the browser. The stated workflow is simple: highlight a paragraph, table, or text on a webpage, then use the side panel to generate a chart or visual automatically.
It appears designed for people who regularly interpret information from the web, including researchers, analysts, and students. Based on the listing, its positioning is a lightweight browser-based visualization tool for quick sense-making rather than a full standalone business intelligence platform.
Features
- Selection-based visualization generation: Users can highlight text, paragraphs, or tables on a webpage and convert that selection into a chart or visual without leaving the page.
- Automatic content analysis: The extension analyzes the selected content and transforms it into a visualization, which helps reduce manual formatting and chart setup.
- Side panel workflow: A “+ Vizion” action in the side panel provides an in-browser way to create and review visuals while staying in the original browsing context.
- Open in new tab for editing: Generated visuals can be opened in a separate tab for further customization, saving, or sharing.
- Per-URL visual management: The side panel lets users browse and manage visuals created from the current webpage, which can help organize page-specific analysis.
- Web content handling disclosure: The extension states that it handles website content and declares that the data is not sold to third parties or used for unrelated purposes, according to the Chrome Web Store privacy disclosure.
Helpful Tips
- Test with structured and semi-structured content: This type of tool is usually most effective when the selected text contains clear numbers, categories, or table-like patterns.
- Validate chart accuracy before sharing: Automatic analysis can speed up exploration, but users should still confirm that labels, groupings, and numeric interpretations match the source content.
- Use it for rapid first-pass analysis: Browser-based visualization tools are well suited for quick research synthesis, but the listing does not establish advanced analytics or governance features.
- Check fit against your workflow depth: If the need is lightweight visual exploration directly from webpages, this extension looks aligned; if the need is complex dashboarding or enterprise reporting, the page does not provide evidence for that scope.
- Review privacy expectations for research use: Since the extension handles website content, teams should compare its disclosed data handling with their internal policies before using it on sensitive material.
OpenClaw Skills
Magic Vizion could likely fit into the OpenClaw ecosystem as the visualization step inside a broader web research and insight-generation workflow. An OpenClaw agent could collect page content, identify candidate data blocks, instruct a user on what to highlight, and then route the resulting visual into downstream tasks such as summarization, briefing creation, or evidence tracking. The Chrome Web Store page does not mention a native OpenClaw integration, so this is a likely use case rather than a confirmed capability.
In practice, this combination could support skills for market scanning, competitive monitoring, academic research assistance, and analyst note production. For example, an OpenClaw workflow could likely watch specific sources, extract structured signals from articles or tables, use Magic Vizion for quick visual interpretation, and then package the result into concise reports. For professions that spend large amounts of time turning scattered web content into explainable insights, that would shift work from manual chart assembly toward faster interpretation and communication.
Embed Code
Share this AI tool on your website or blog by copying and pasting the code below. The embedded widget will automatically update with the latest information.
<iframe src="https://aimyflow.com/ai/chromewebstore-google-com-detail-columnsai-hfgfkpoildikklbmjnkedmapiopeacga/embed" width="100%" height="400" frameborder="0"></iframe>
Explore Similar Tools
SQL Query Builder & Generator - AI Powered Database Assistant
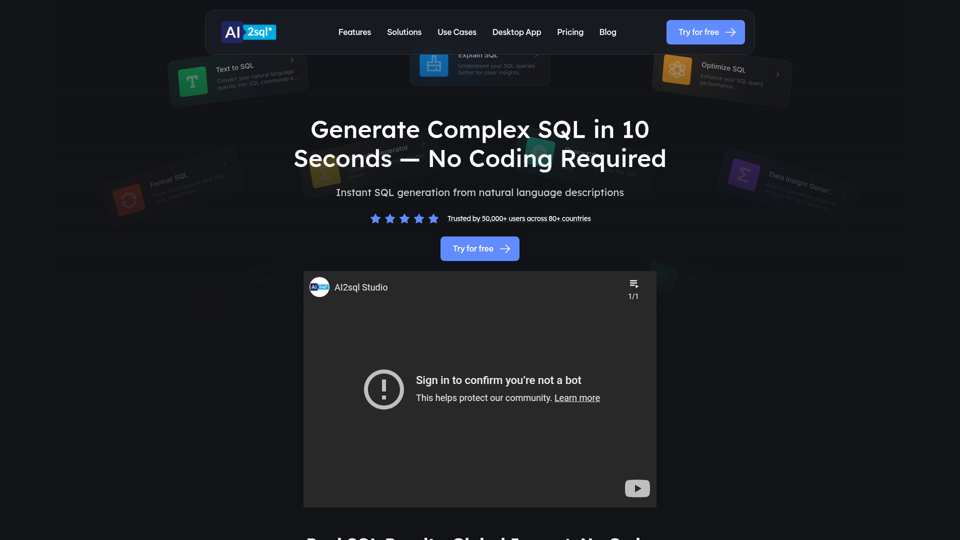
AI2SQL is an AI-powered SQL query builder and database assistant that turns natural language into SQL or NoSQL queries, and also helps explain, fix, optimize, validate, and format queries for beginners, analysts, developers, and database users. In AI-assisted data work, it can help analysts, engineers, and SQL learners move faster from questions to usable queries while reducing time spent on syntax and troubleshooting.
Columns: build data workflow
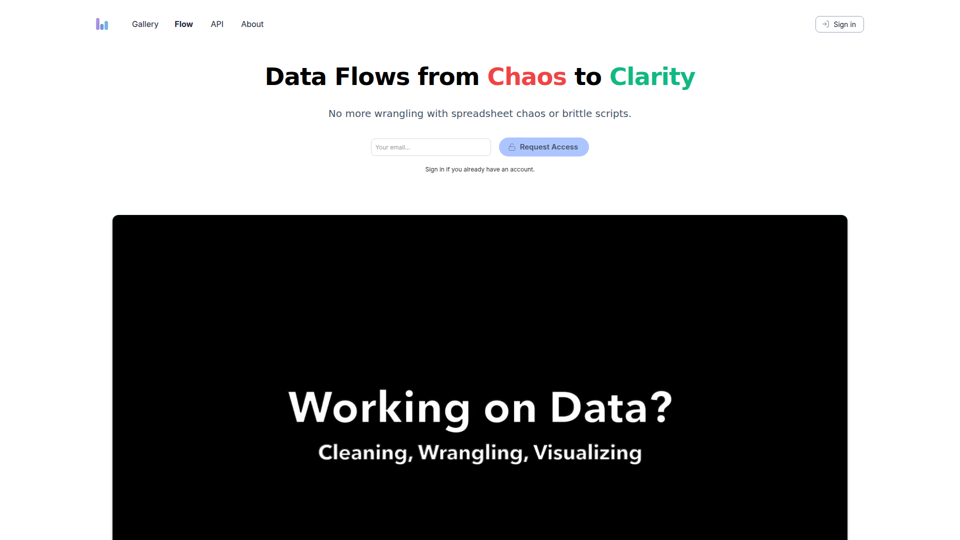
Columns Flow is a data workflow tool that helps spreadsheet users, analysts, engineers, and managers turn connected data sources into visual reports, automated updates, alerts, and shareable summaries using plain-language transformations. For data and operations teams, it can reduce manual wrangling and brittle scripts while keeping reporting and downstream handoffs more consistent in AI-assisted workflows.
StatPecker · Smart insights for business, stunning visuals for content creators.
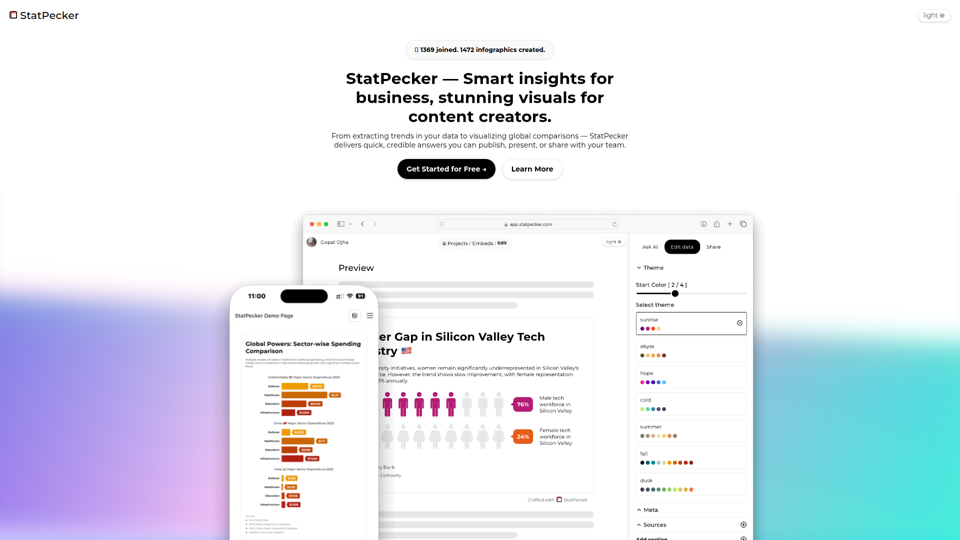
StatPecker is an AI data insight and visualization tool that helps users ask questions about data, analyze local CSV files privately on-device, and create publishable charts and infographics, mainly for content writers and data analysts. In AI-assisted content and reporting workflows, it can help analysts and writers turn raw data into credible visuals faster for articles, presentations, and team sharing.
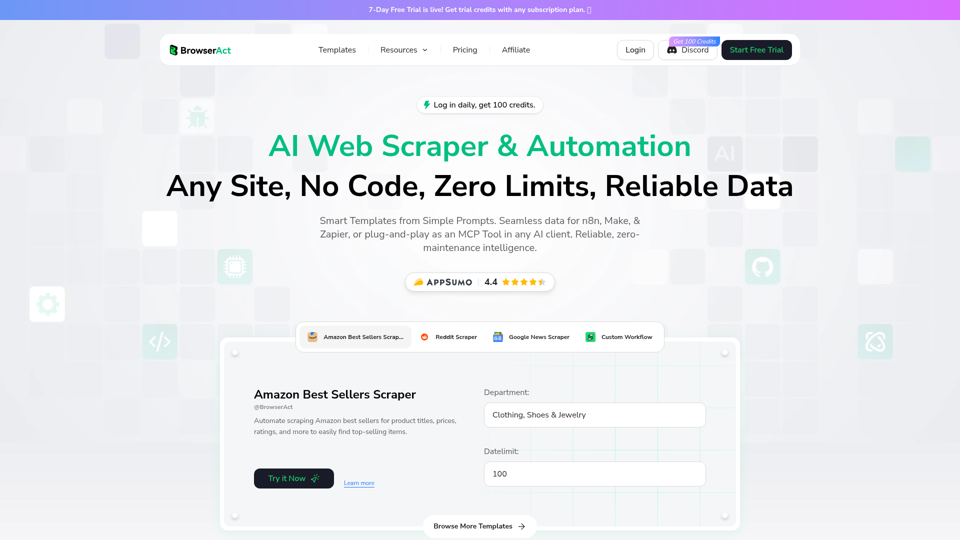
BrowserAct — AI‑powered No‑Code Web Scraper & Automation
BrowserAct is an AI-powered no-code web scraper and browser automation tool that helps users extract website data and build automated workflows from natural language prompts, mainly for operations teams, analysts, and developers. In AI-driven data workflows, it can reduce manual scraping upkeep by turning websites into reusable automation steps for research, monitoring, and system-to-system data handling.
AtlasGrid
AtlasGrid is a data context tool that helps users place and organize information on a visual grid, mainly for teams working with complex datasets and relationships. In an AI-driven workflow, it can help analysts and operators keep data structured and contextualized so models and people can interpret connections more reliably.
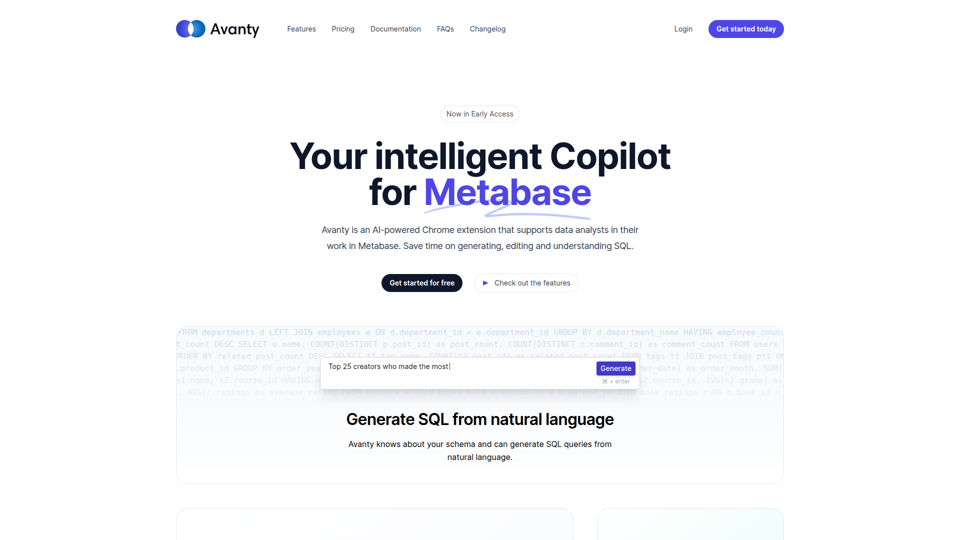
Avanty - AI assistant for data analysts in Metabase.
Avanty is an AI-powered Chrome extension for Metabase that helps data analysts generate, edit, explain, format, and comment SQL queries faster using natural language and schema metadata. For analytics teams and BI professionals, it can reduce time spent on repetitive query writing and make complex SQL easier to review, document, and debug in AI-assisted workflows.
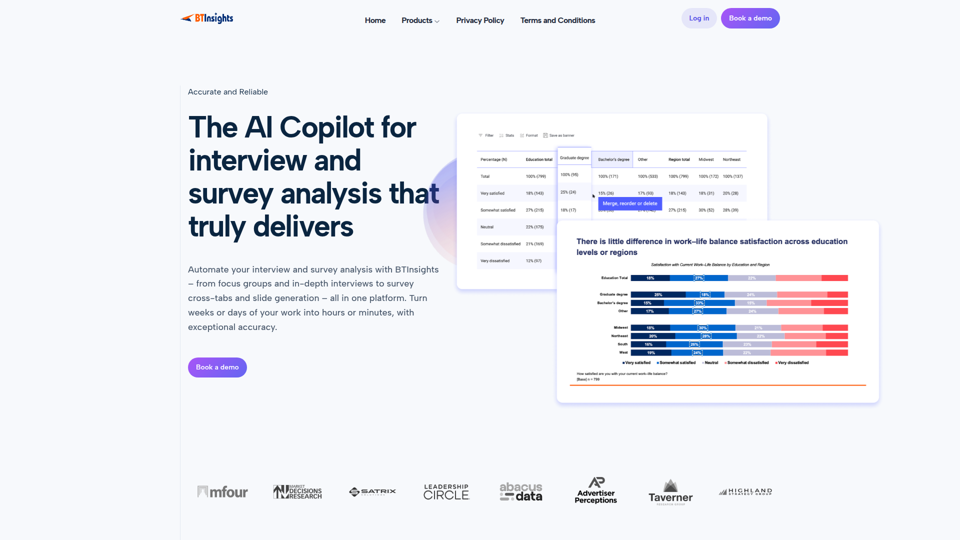
BTInsights | AI Copilot for Interview and Survey Analysis
BTInsights is an AI qualitative research platform that helps market researchers analyze interviews, focus groups, survey open ends, and crosstabs, with tools for transcription, traceable insights, coding, and slide generation. For research and insights teams, it can shorten manual analysis and reporting while keeping findings linked to source data for faster review and client delivery.
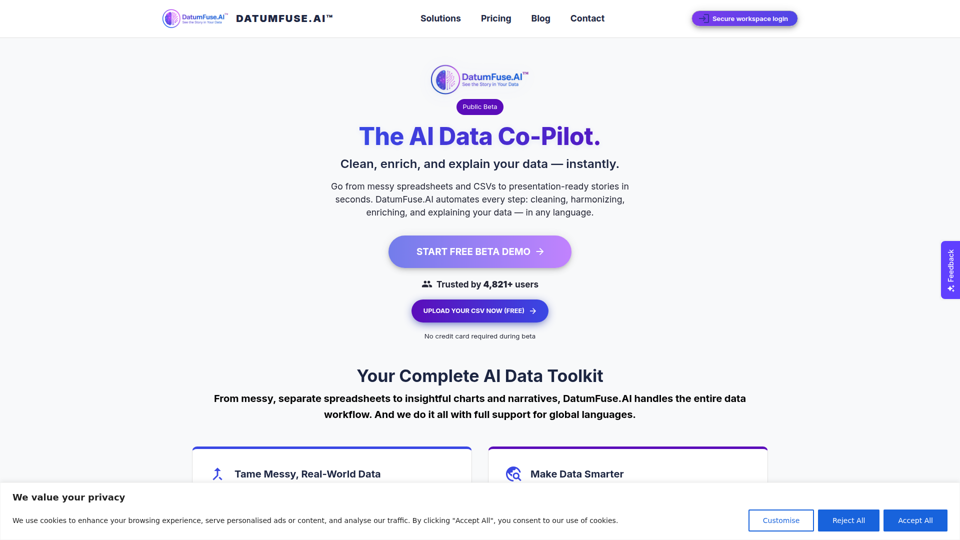
DatumFuse.AI – AI Platform for Data Cleaning, Harmonization, Augmentation, Narration & Visualization
DatumFuse.AI is an AI data platform that helps users clean, harmonize, augment, visualize, and narrate spreadsheet and CSV data, mainly for teams and professionals working with messy business datasets. For marketers, operations teams, consultants, and presenters, it can reduce manual data wrangling and speed up turning exports into clearer charts, summaries, and decision-ready reports.