
AtlasGrid

Rate this Tool
Average Score
Total Votes
Select your score (1-10):
Detail Information
What
AtlasGrid appears to be an early-stage product focused on putting “your data in context.” Based on the page content, it is likely a data organization, mapping, or contextualization tool that helps users place information onto a structured “grid” or visual framework.
The page suggests a product still in early access, with a launch video and a team background from Dropbox, Meta, and Life360. Because the available content is limited, the exact workflow, target user segments, and technical scope are not fully confirmed; its likely positioning is an emerging data workflow product centered on contextual understanding and visual placement of information.
Features
- Data contextualization: The core message, “Your data in context,” indicates a focus on helping users organize or interpret data within a broader structure rather than viewing it in isolation.
- Grid-based or node-based interface: References to placing items “on the grid” and embedded React Flow controls suggest a visual environment for arranging connected objects or entities.
- Interactive graph editing: The page text describes selecting, moving, and deleting nodes and edges, which points to hands-on manipulation of relationships in a visual canvas.
- Early access availability: Users can request early access, indicating the product is in a limited release stage suitable for design partners or early evaluators.
- Launch video support: A launch video is available, which can help prospective users understand the intended workflow where the webpage itself provides only limited detail.
Helpful Tips
- Validate the actual use case before adoption: The public page is sparse, so buyers should confirm whether AtlasGrid is meant for analytics, knowledge mapping, operational planning, or another data-centric workflow.
- Assess the importance of visual graph interaction: If your team works with entities, relationships, or spatial/contextual mapping, the node-and-edge interface may be useful; otherwise, a simpler data tool may fit better.
- Expect product maturity tradeoffs: Early access products can offer novel workflows, but teams should confirm product stability, onboarding depth, and roadmap alignment before broader rollout.
- Review the launch materials closely: Since the landing page gives limited functional detail, the launch video is likely the best source for understanding real workflows and practical value.
- Clarify target users internally: This kind of product may appeal differently to operations, intelligence, research, or data teams, so internal ownership should be defined early.
Embed Code
Share this AI tool on your website or blog by copying and pasting the code below. The embedded widget will automatically update with the latest information.
<iframe src="https://aimyflow.com/ai/atlasgrid-ai/embed" width="100%" height="400" frameborder="0"></iframe>
Explore Similar Tools
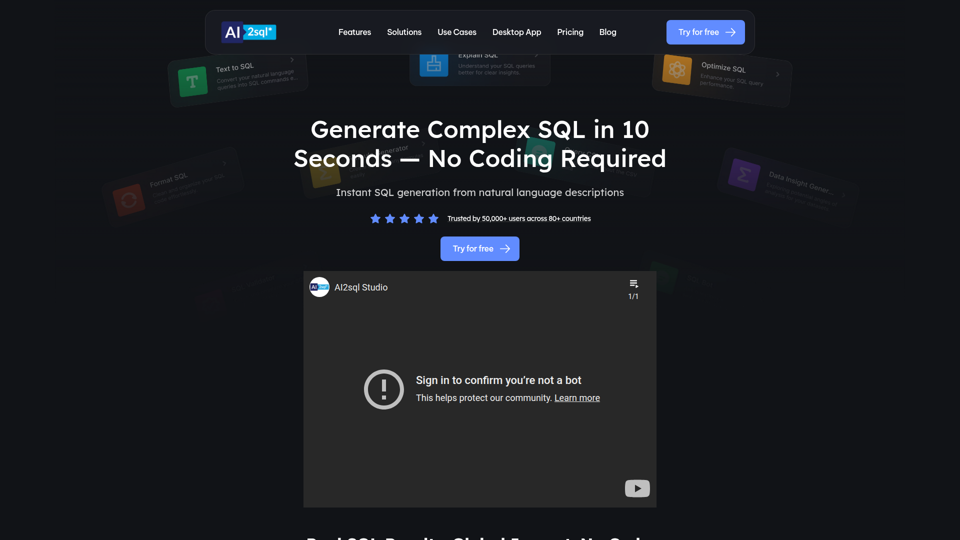
SQL Query Builder & Generator - AI Powered Database Assistant
AI2SQL is an AI-powered SQL query builder and database assistant that turns natural language into SQL or NoSQL queries, and also helps explain, fix, optimize, validate, and format queries for beginners, analysts, developers, and database users. In AI-assisted data work, it can help analysts, engineers, and SQL learners move faster from questions to usable queries while reducing time spent on syntax and troubleshooting.
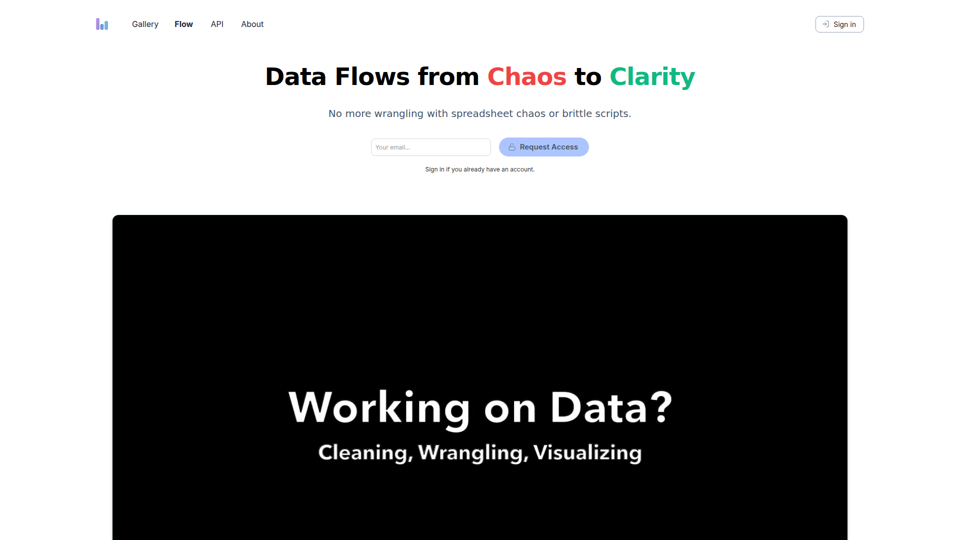
Columns: build data workflow
Columns Flow is a data workflow tool that helps spreadsheet users, analysts, engineers, and managers turn connected data sources into visual reports, automated updates, alerts, and shareable summaries using plain-language transformations. For data and operations teams, it can reduce manual wrangling and brittle scripts while keeping reporting and downstream handoffs more consistent in AI-assisted workflows.
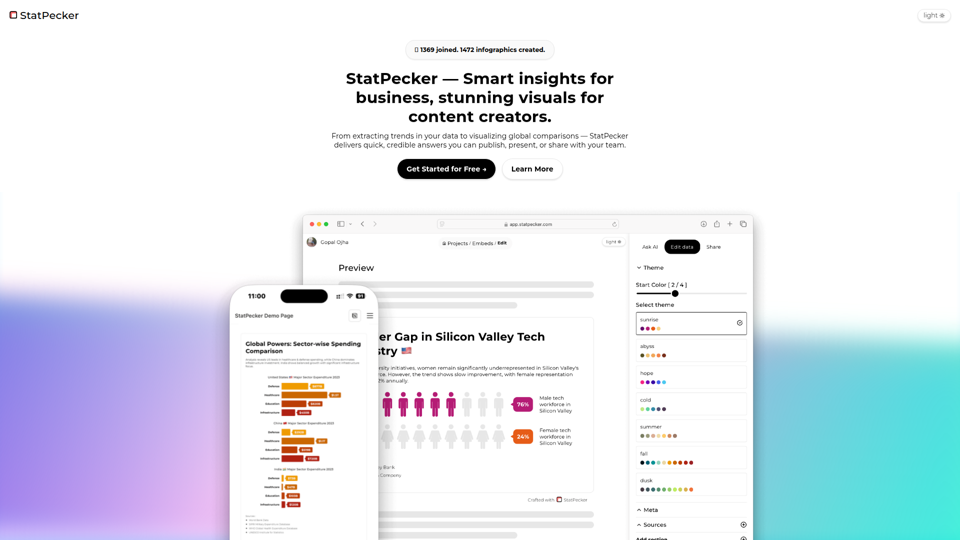
StatPecker · Smart insights for business, stunning visuals for content creators.
StatPecker is an AI data insight and visualization tool that helps users ask questions about data, analyze local CSV files privately on-device, and create publishable charts and infographics, mainly for content writers and data analysts. In AI-assisted content and reporting workflows, it can help analysts and writers turn raw data into credible visuals faster for articles, presentations, and team sharing.
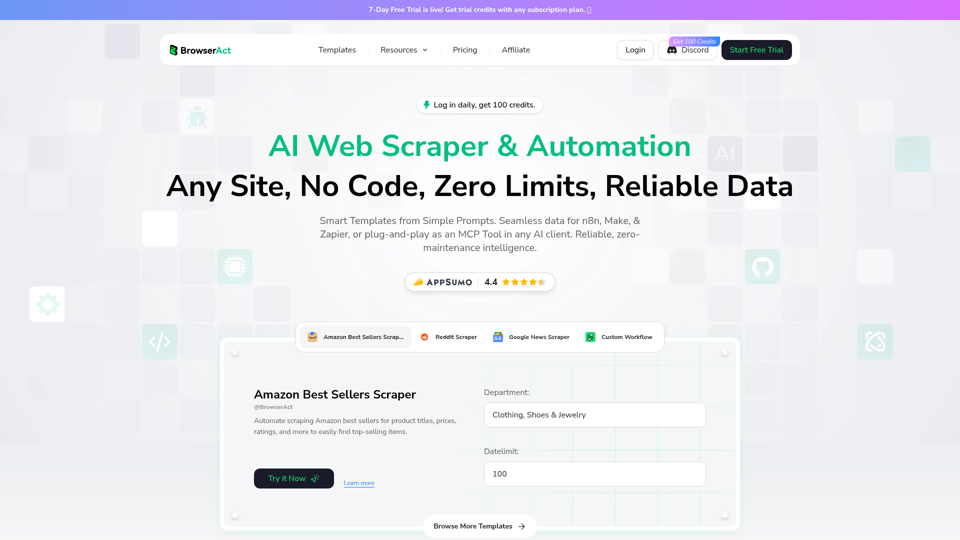
BrowserAct — AI‑powered No‑Code Web Scraper & Automation
BrowserAct is an AI-powered no-code web scraper and browser automation tool that helps users extract website data and build automated workflows from natural language prompts, mainly for operations teams, analysts, and developers. In AI-driven data workflows, it can reduce manual scraping upkeep by turning websites into reusable automation steps for research, monitoring, and system-to-system data handling.
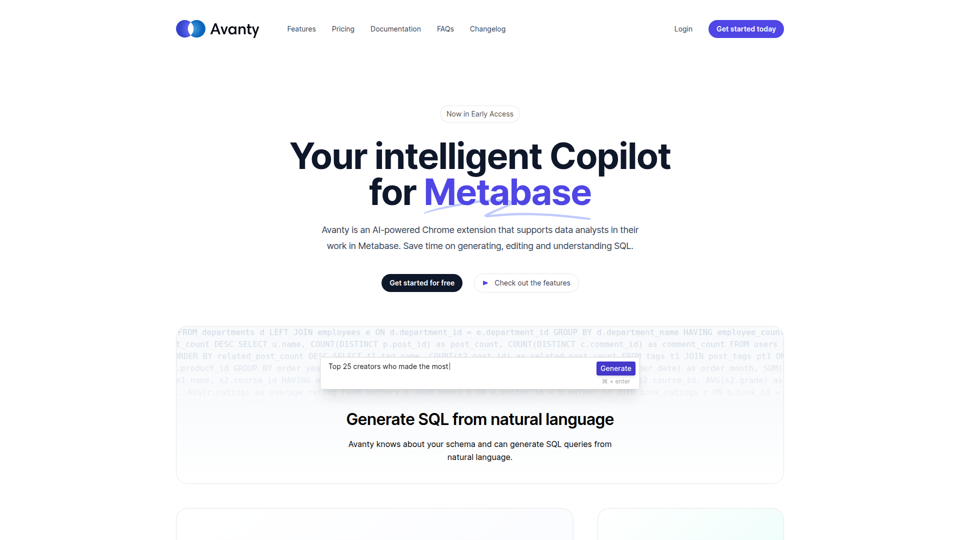
Avanty - AI assistant for data analysts in Metabase.
Avanty is an AI-powered Chrome extension for Metabase that helps data analysts generate, edit, explain, format, and comment SQL queries faster using natural language and schema metadata. For analytics teams and BI professionals, it can reduce time spent on repetitive query writing and make complex SQL easier to review, document, and debug in AI-assisted workflows.
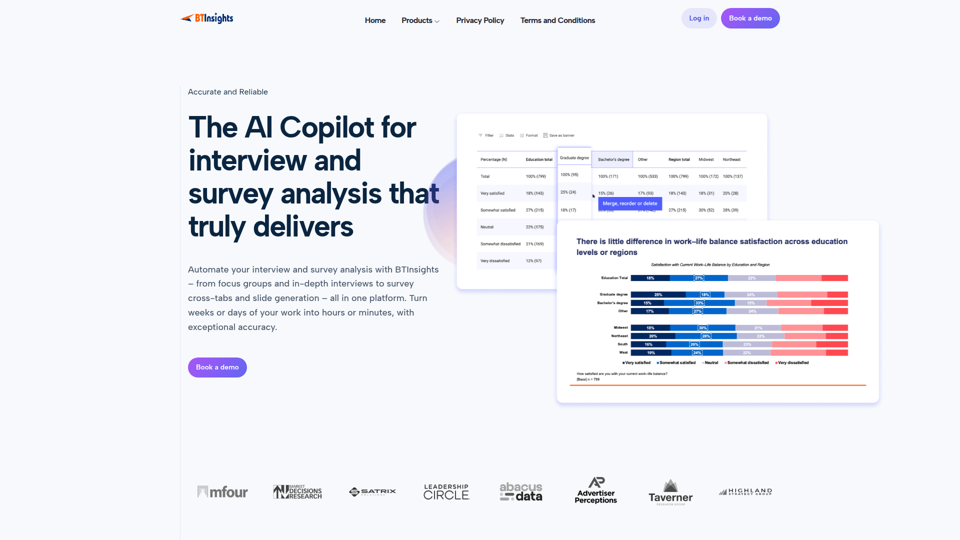
BTInsights | AI Copilot for Interview and Survey Analysis
BTInsights is an AI qualitative research platform that helps market researchers analyze interviews, focus groups, survey open ends, and crosstabs, with tools for transcription, traceable insights, coding, and slide generation. For research and insights teams, it can shorten manual analysis and reporting while keeping findings linked to source data for faster review and client delivery.
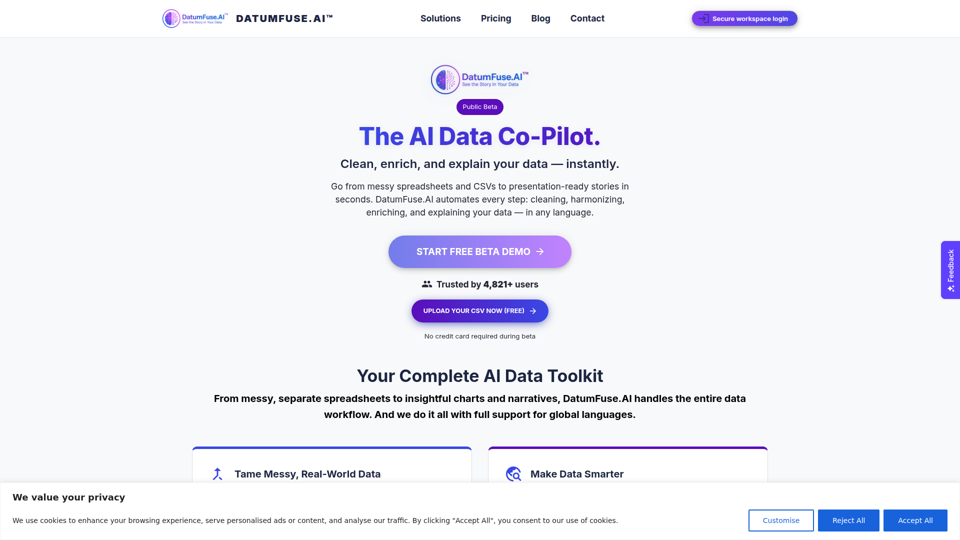
DatumFuse.AI – AI Platform for Data Cleaning, Harmonization, Augmentation, Narration & Visualization
DatumFuse.AI is an AI data platform that helps users clean, harmonize, augment, visualize, and narrate spreadsheet and CSV data, mainly for teams and professionals working with messy business datasets. For marketers, operations teams, consultants, and presenters, it can reduce manual data wrangling and speed up turning exports into clearer charts, summaries, and decision-ready reports.
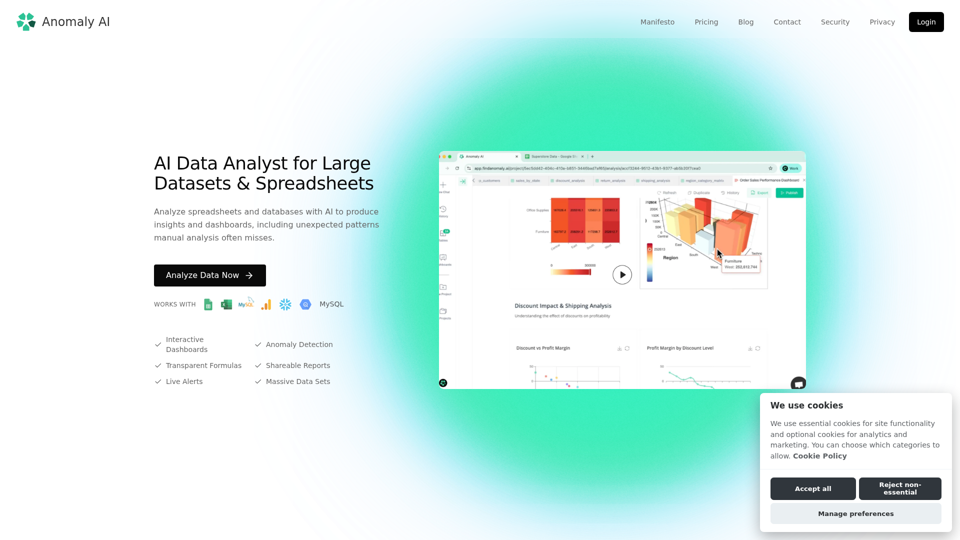
AI Data Analyst for Large Datasets & Spreadsheets
Anomaly AI is an AI data analyst for large datasets and spreadsheets that helps teams analyze Excel, Google Sheets, BigQuery, and databases to generate insights, dashboards, and anomaly detection, mainly for spreadsheet-oriented business and analytics teams working beyond Excel’s limits. In AI-driven analytics workflows, it can help analysts, operations, finance, and product teams verify metrics faster and surface patterns or risks that manual review may miss.